What we are building
To make cancer diagnostics that work in every laboratory — not only in the one where they were built.
Measured
We do not claim realism. Every statistic is placed against real reference intervals and published.
Unbiased
Device, stain and disease are drawn independently, so the shortcut a network would take never exists.
Labelled at Source
The pixel-level mask is produced with the scene, never inferred afterwards. No expert hours needed.
LuminaPath
We compute how light travels through a microscope and produce training images that arrive already labelled — nothing painted, nothing annotated afterwards. Every confounder is sampled independently of the diagnosis, so a model trained on our data learns the disease, not the scanner.
What we ship
Two demo disease models. Full datasets are generated to order and calibrated to your instrument.
Why diagnostic AI does not travel
Diagnostic AI does not fail because the models are weak. It fails because of how the data was collected.
“Of 2,212 models developed for clinical use, the number that can be safely used in the real world is zero — shortcut learning, data imbalance and domain shift rule out every one of them.”
Roberts et al., Nature Machine Intelligence (Cambridge)Shortcut Learning
A network learns the cheapest signal that separates the classes — often the scanner or stain batch, because disease and collection method arrive together.
Domain Shift
The same metastasis-detection CNN scores 88.0% on its own scanner and 51.2% on another. The failure only shows at a new hospital.
Eight things that decide what a model sees. Seven of them are written down nowhere.
| Variable | Why it breaks the balance | Recorded? |
|---|---|---|
| Hospital type | Rare cases go to specialist centres | Yes |
| How long the blood waited | Morphology degrades in stored blood | No |
| Smear technique | Thickness and cell distribution change | No |
| Stain freshness | Colour balance and contrast drift | No |
| Decision to photograph | Abnormal cases get the careful shot | No |
| File format and compression | Compression alters texture detail | No |
| Microscope oil and servicing | Optical clarity and colour balance drift | No |
| Who prepared the slide | Personal hand habit shows in the result | No |
Only balance removes a bias — and an unrecorded variable cannot be balanced.
How we build the data
Physics-based synthetic data — unlimited, unbiased and perfectly labelled at the source.
Physics-Based
Light is computed, not painted
- Point spread function, numerical aperture, focus and illumination as direct inputs
- Measured stain vectors, colour profile, sensor noise and artefacts
- No generative model, no diffusion, no hallucinated tissue
Variation & Precision
Every variable under separate control
- Stain batch, scanner profile and smear thickness drawn without reference to the label
- The same scene regenerated with only the focus, only the stain or only the NA changed
- No correlation between a colour cast and a diagnosis
Rule-Based Control
Physiology is a constraint, not a suggestion
- Cell types, proportions and arrangement set by disease stage
- Rare morphologies generated on specification, with expert confirmation
- No physiologically impossible output, however good the fit looks
Real Data
- Privacy constraints and ethical review at every transfer
- Specialist annotation hours for every single cell
- Confounders unrecorded, and therefore impossible to balance
- Rare morphologies almost absent from any archive
- The same smear cannot be re-imaged through five different optics
LuminaPath Technology
- No patient data involved — no privacy exposure at any point
- Pixel-level labels produced with the scene, at zero annotation cost
- Every confounder sampled independently of the diagnosis, by construction
- Rare cells produced from specification in seconds, thousands of digital twins
- Calibrated to your instrument from as few as 5 anonymised images
The experiment you cannot run on real data
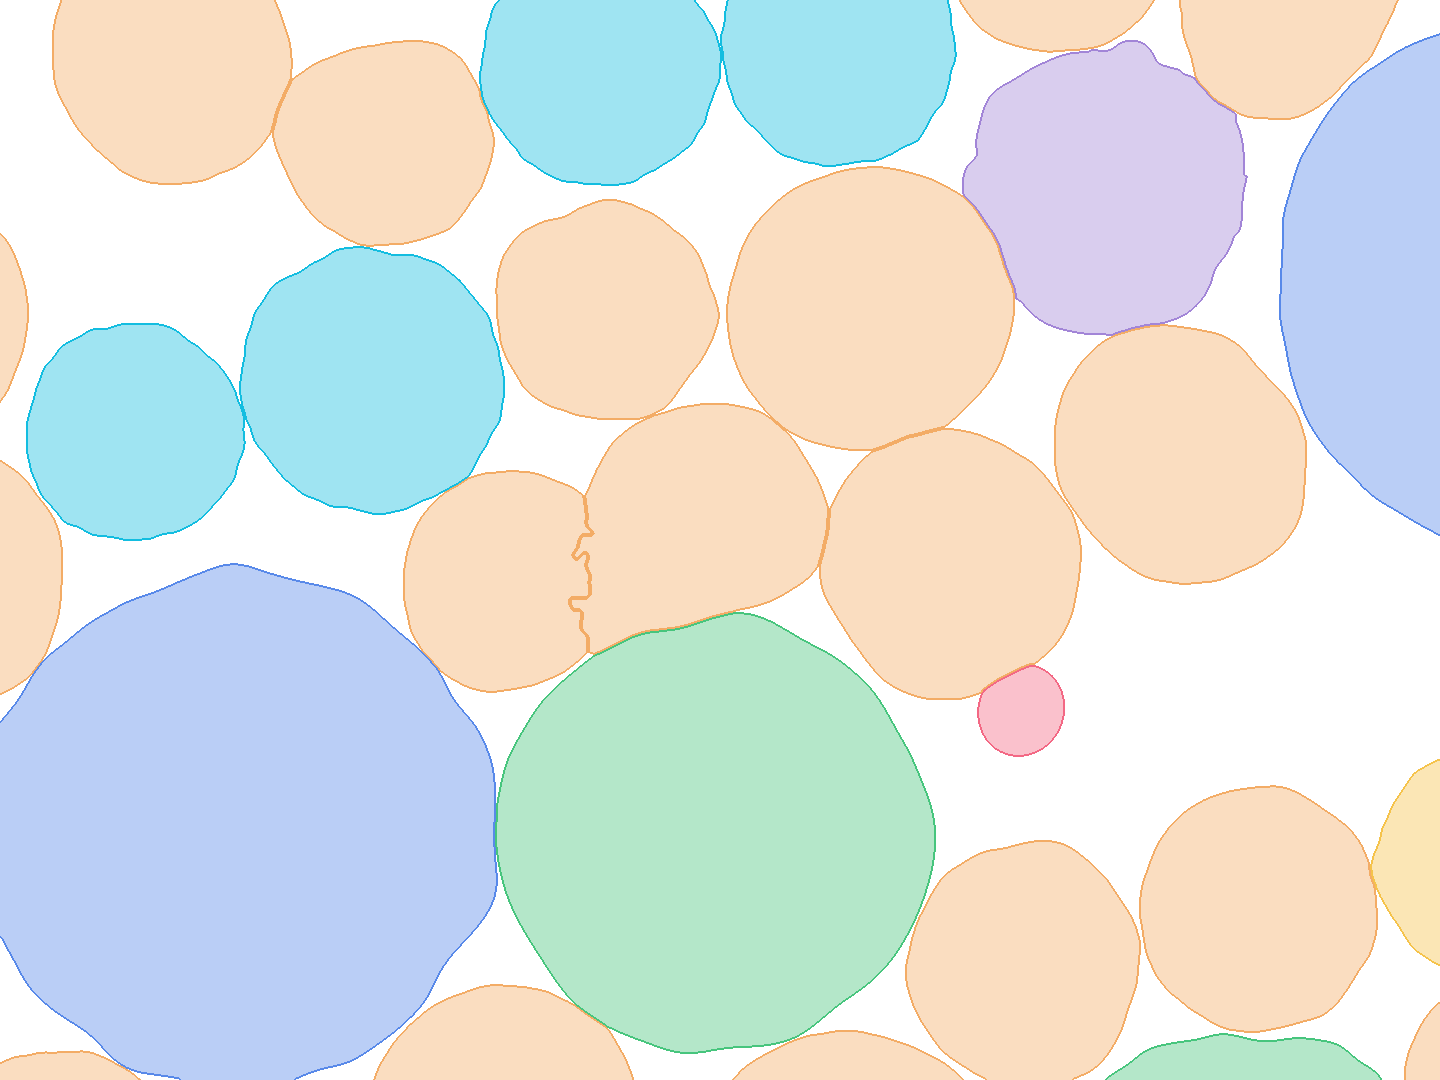
One scene, nineteen parameters, each moved on its own. Drag the slider, turn on the label — it never moves.
- Frame
- 1440 × 1080 px
- Sampling
- 0.0325 µm/px
- Field of view
- 46.8 × 35.1 µm
- Objective
- 100× oil, NA 1.30
- Condenser
- NA 0.95 (σ 0.73)
- Spectral sampling
- 5 bands, 435–655 nm
- Sensor
- 12-bit colour CMOS
- Full well
- 12 000 e⁻
- Scene seed
- 1313
- Labels
- instance + semantic
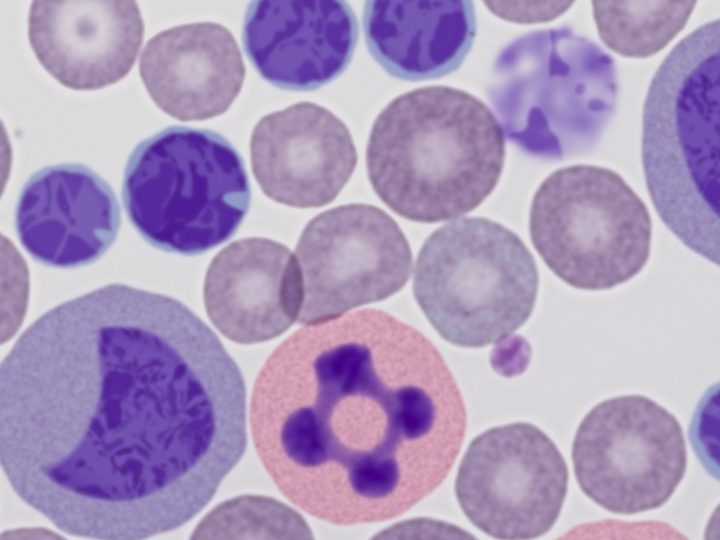
 NA 1.30
←→ value · ↑↓ parameter
Every pixel that differs from the default frame, scaled so the faintest change is still visible. The labels are not in this picture — they never move.
Same 29 cells, same positions, same labels: the mask is the scene itself, never inferred from the image.
Scope and limits
Innovation through simulated light.
The Future of Diagnostics
Synthetic data does not replace real data: clinical evidence still comes from real patients. Our value is in training, pre-adaptation for a new site, and robustness testing. Our engine makes no diagnosis and is not a medical device.
Unprecedented Realism and Accuracy
Can you tell our synthetic blood smear from a real one?
One of these two fields is a real blood smear. Click the one you think is real.
Both fields are shown at the same magnification and through the same display pipeline.
Physics- and Rule-Based Generation — Without Generative AI or Diffusion Techniques
Computed from a scene specification and an optical model — no GAN, no diffusion. An impossible cell cannot appear, and every pixel carries its label.
Why Synthetic Data Is Superior
The generation chain
The scene is built first, then light is computed through the microscope. The scene plan is the answer key.
The generation chain — how a scene specification becomes a measured image — is the subject of a pending patent application filed with TÜRKPATENT (Turkish Patent and Trademark Office) no. 2026/015642, filed 13 September 2026. On this page we describe what it guarantees, not how it is assembled. Technical detail is shared under NDA with pilot partners.
Scan the code to verify the filing on TÜRKPATENT's official e-document verification service (EPATS).
Measured, not claimed
Every statistic is placed against the interval spanned by two independent real datasets.
No overlap in illumination
The two real datasets do not overlap on this axis; both fall inside our range.
We rejected a better number
A lower-error fit gave the red cell an impossible value. We chose the biology.
Still open
Edge sharpness is still below both real datasets; the fix is under test.
What We Measured
Each acceptance criterion was written before the run. Numbers we could not confirm by measurement are not on this page.
+0.33 AUC
With 5 real examples per class. Synthetic pre-training adds +0.33 AUC on smudge cell versus lymphocyte, against a control trained for the same number of updates.
0.847 AUC
Zero real images in training. A model trained only on synthetic data separates real smudge cells from lymphocytes (32 seeds). Chance: 0.50; fully real-trained ceiling: 0.991.
3% deviation
Prediction confirmed. A ruptured cell keeps its chromatin: across 988 real cells, real 0.920, model 0.948.
2.6× fewer labels
Annotation saving. On smudge cell versus lymphocyte, 5 real examples per class plus synthetic pre-training match 13 real examples alone (32 seeds). 4× and 5× were tested and ruled out; on blast classification we measured no saving.
| Layer | Status |
|---|---|
| Optical chain | verified Two independent acquisition paths agreed to within 0.6% at every stain density. |
| Cell-level morphology | verified Against a 41,621-cell expert-labelled reference set, smudge cells included. |
| Transfer on pathological cells | measured 0.847 AUC from synthetic-only training (32 seeds); real-data ceiling 0.991. |
| Scene level: stage and proportions | verified Stage-dependent cell proportions checked against clinical reference data. |
Run it on your own data
Send at least 5 anonymised images and your instrument's basic specification. We match our data to your optics and stain; you run the evaluation.
Two weeks. No fee. The success criterion is agreed in advance, together.
Contact
Talk to us about the future of medical diagnostics.
Get in Touch
Write to us directly, or use the form. We answer with a scope, a timeline and what we would need from you to start.
Research partners
Cerrahpaşa Faculty of Medicine
University of Cambridge (advisory)
Status
First paid delivery completed. Clinical validation completed.